I am a dedicated business analyst with over five years of experience with a proven track record of improving efficiency and productivity by providing actionable easy to understand data to drive decisions. I am experienced at communicating with clients, managers, and executives to identify data visualization needs and create intuitive reports revealing meaningful patterns and trends.
Projects I've worked on
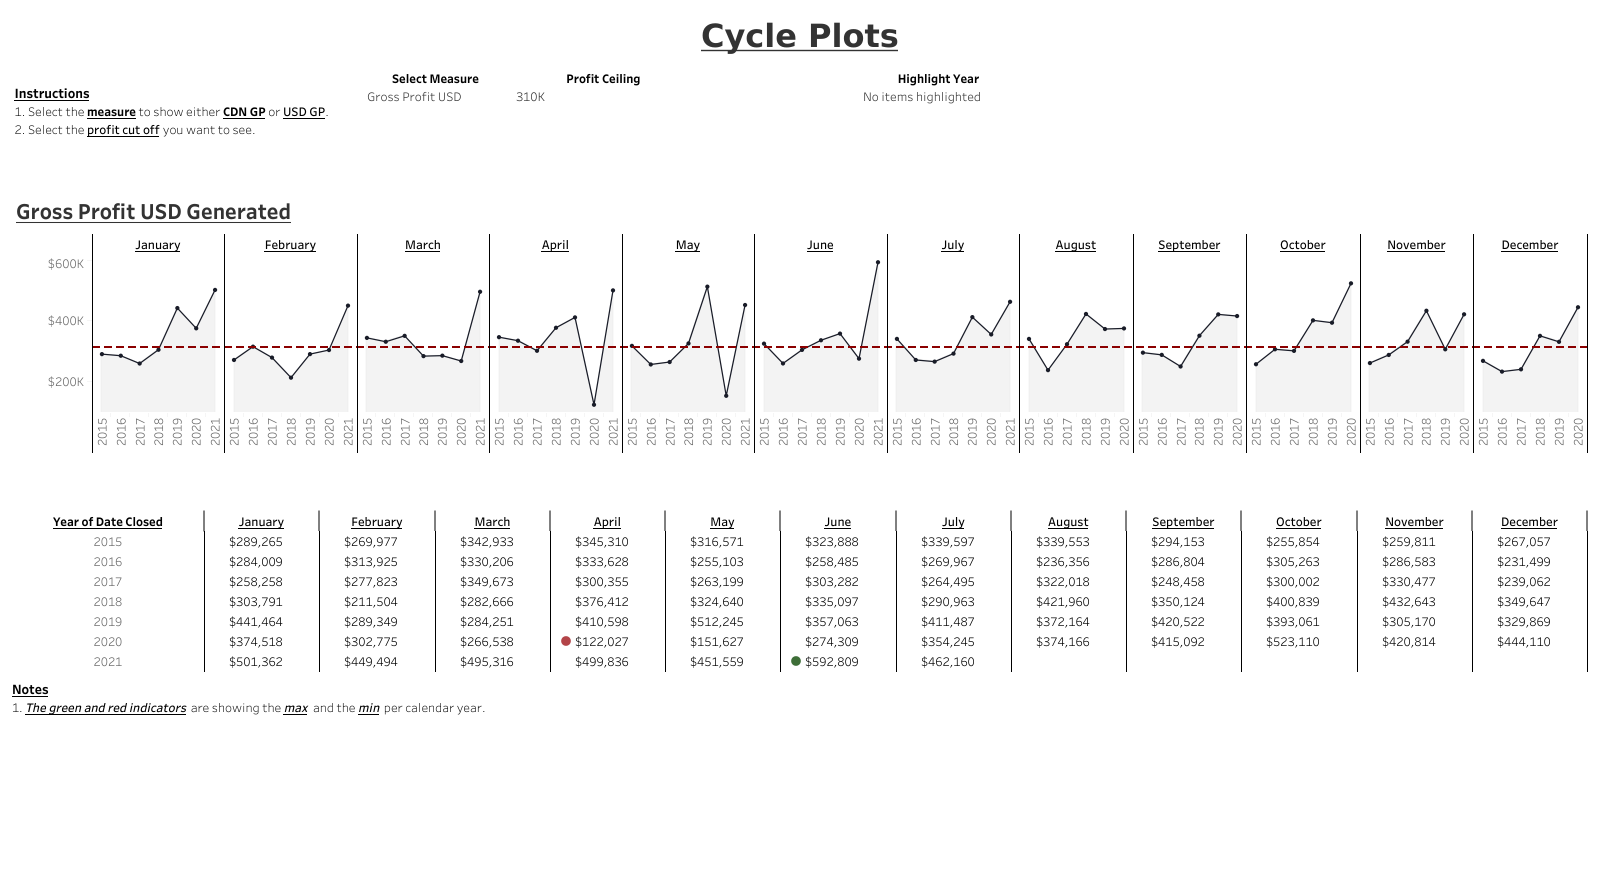
Cycle Plots
Business question: What is our best month in the past five years, and is there seasonal factors?
Use case: Cycle plots are great to see historical performance and quickly spot the best historical months in the year.
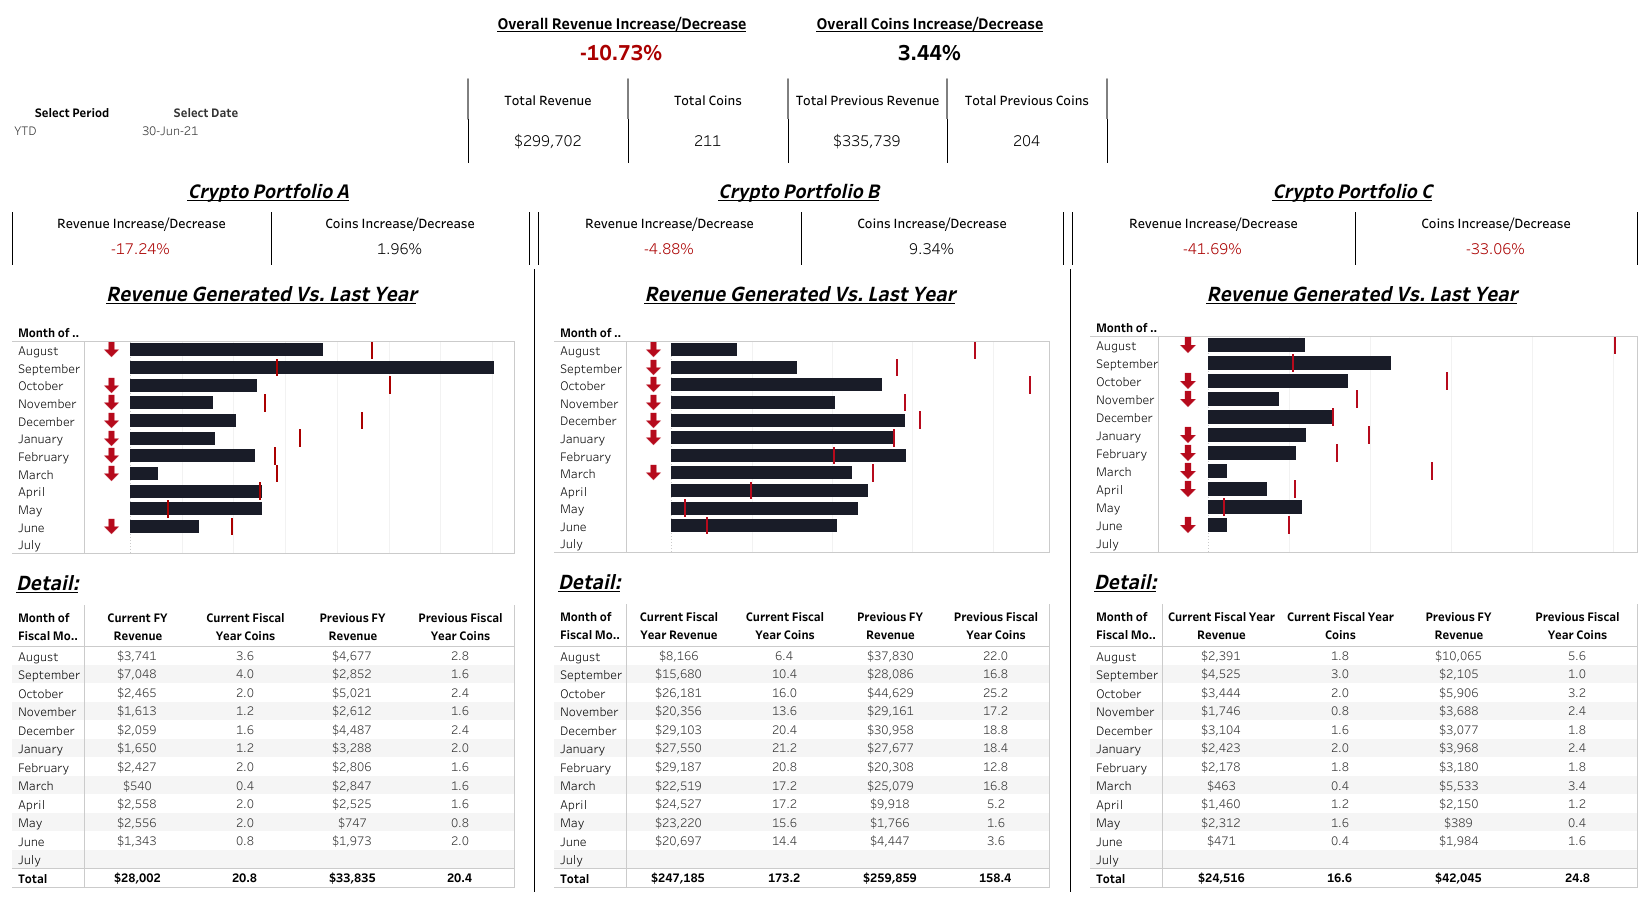
Portfolio Performance
Business question: How is our portfolio performing against the previous period?
Use case: This view shows the audience a breakdown by month vs. the same period last year to see problematic or outperforming months. It gives an overall performance while showing individual contributions.
Oportunity Tracker
Business question: How is cash flow looking for the foreseeable future based on the pipeline?
Use case: This view allows users to select a time frame. The following 60 days for example, dissect it by opportunity stage and find out how much revenue is projected to come.
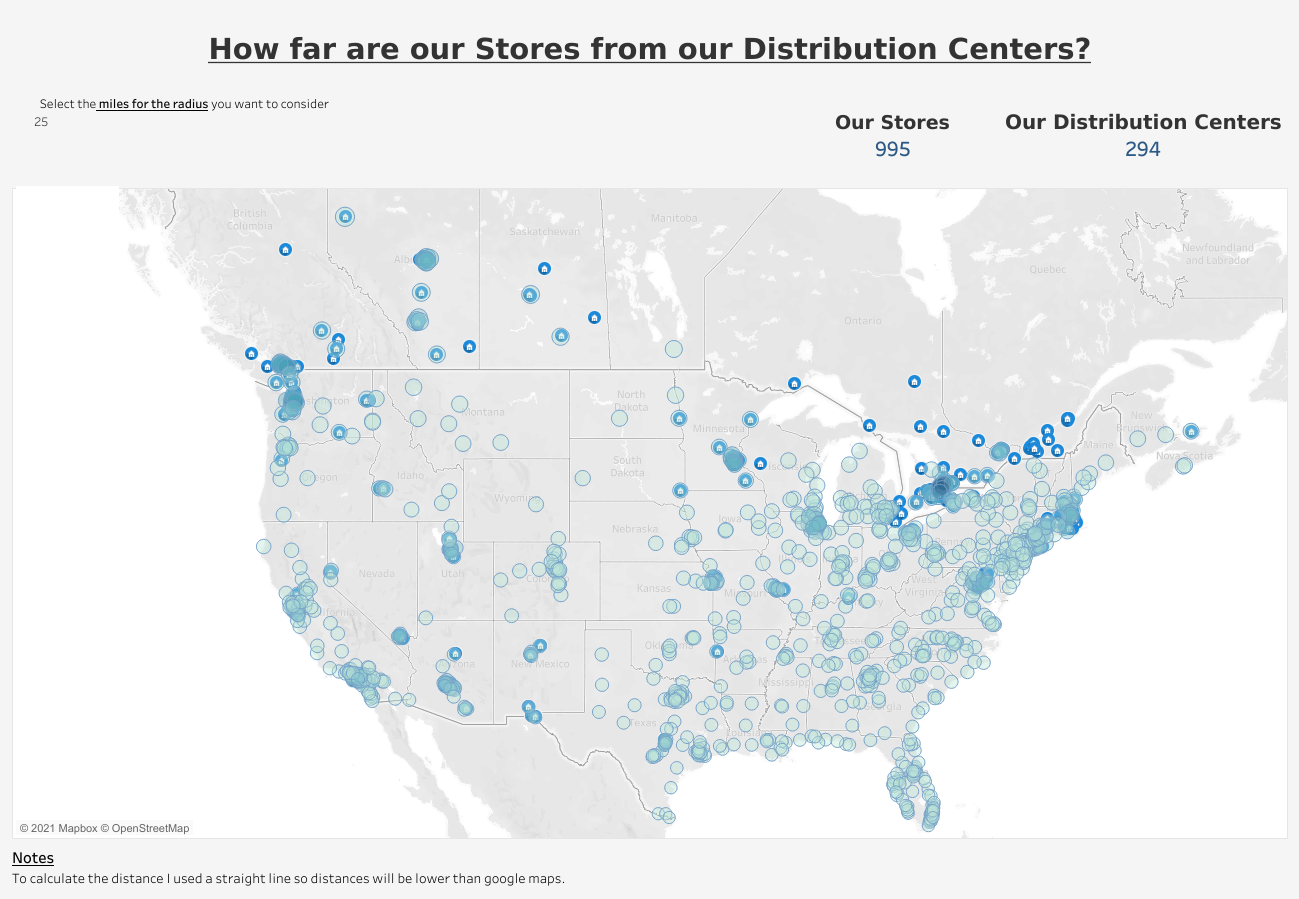
Optimize Distribution Center Locations
Business question: Where do we place new distribution centers to cover our stores better?
Use case: This map lets us control a milage radius to plan how far we want our distribution center's territory. Plotting it against stores or zones of interest and combining it with population data is a great way to project new store openings.
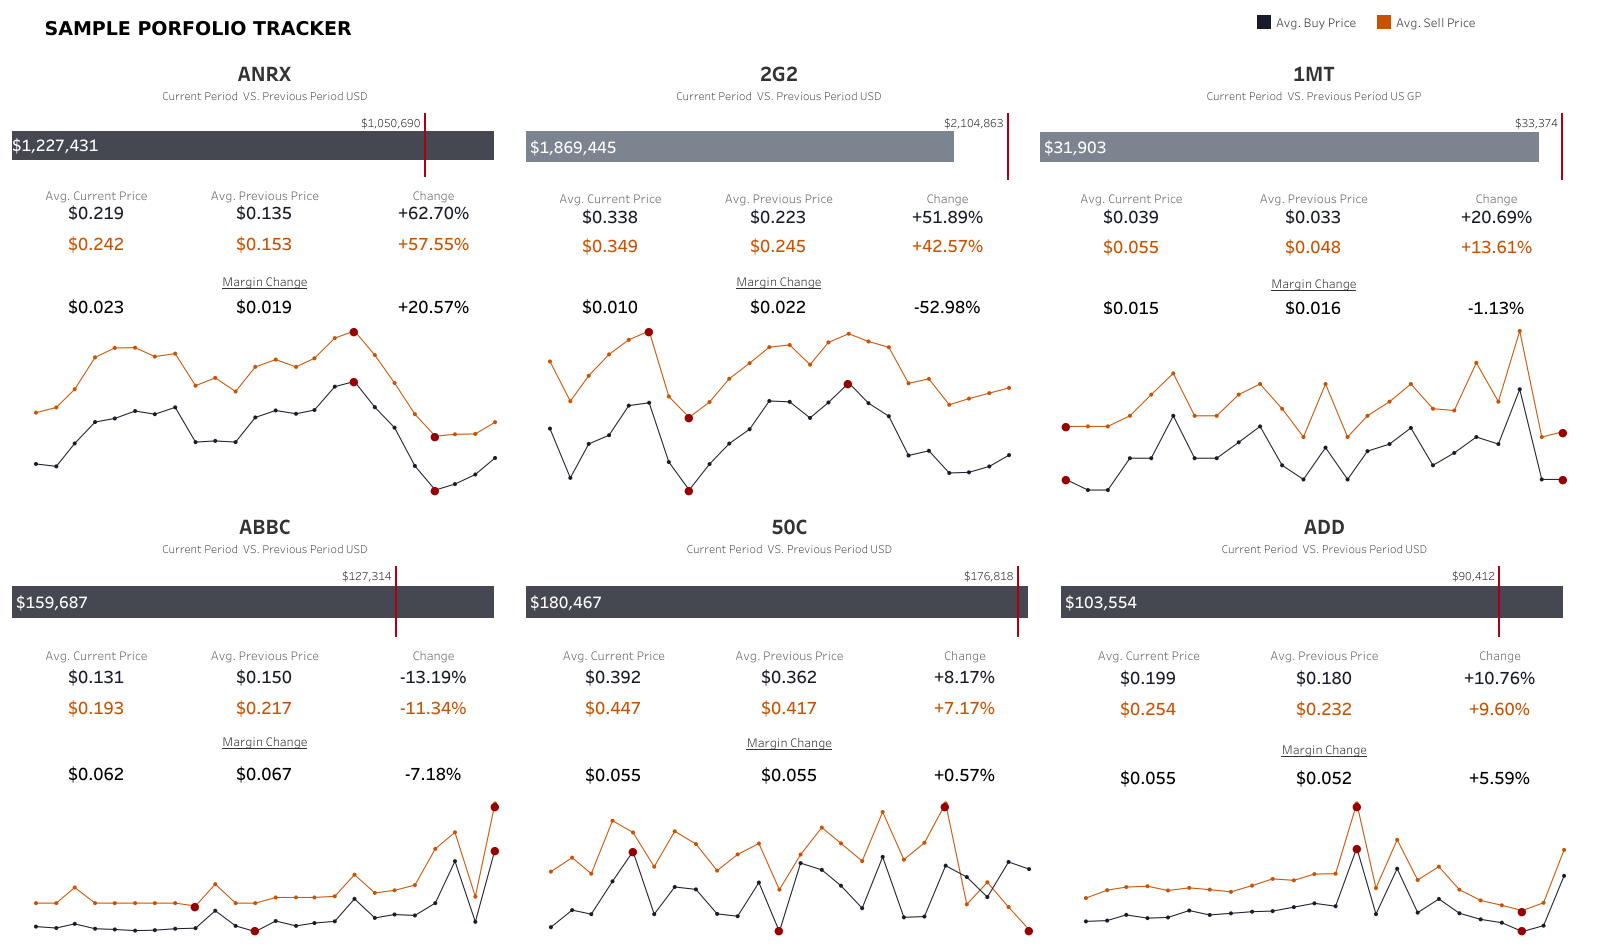
Sample Portfolio Tracker
Business question: Are our assets performing better than last year?
Use case: This view shows the audience whether or not we are increasing or decreasing our average margin per commodity to spot problematic investments, buying vs. selling trends, and whether we are on track to surpass last year's performance.
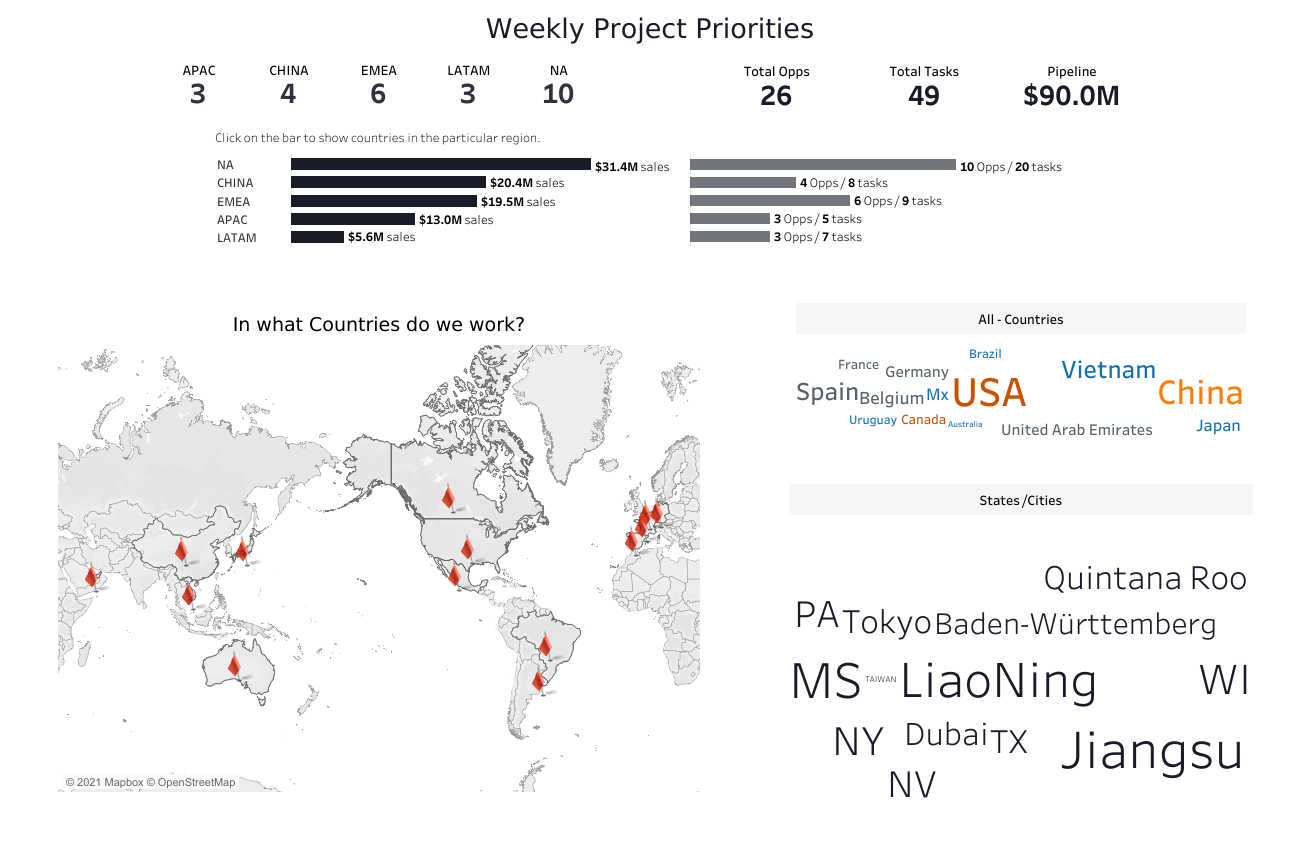
Weekly Project Priorities
Business question: Where are we doing business in the world?
Use case: This map shows us our best-performing regions and in what countries we have a presence. It could be great to show where to allocate resources.
Yearly Growth
Business question: Are we growing year over year, and where do we have gaps?
Use case: This view allows the audience to spot decreases in transactions, revenue, or average performance against the same period and see what months are down or up.
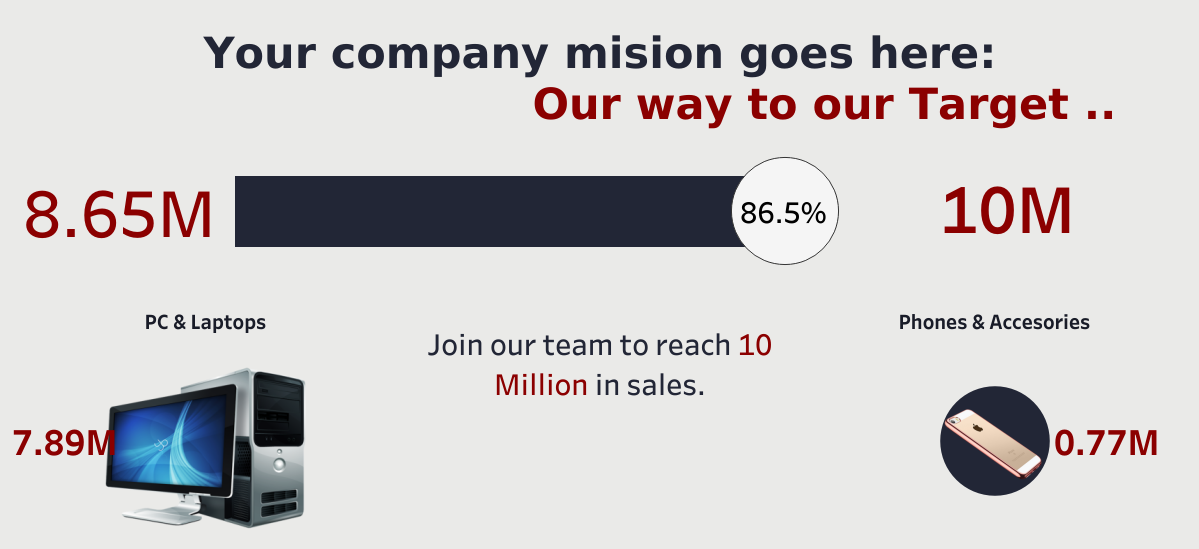
Company Targets
Business question: How is the company moving against its 5 to 10-year goal?
Use case: The ask was to create a marketing piece to put on the website and share with our customers. It needed to reflect daily sales by product type against goal.